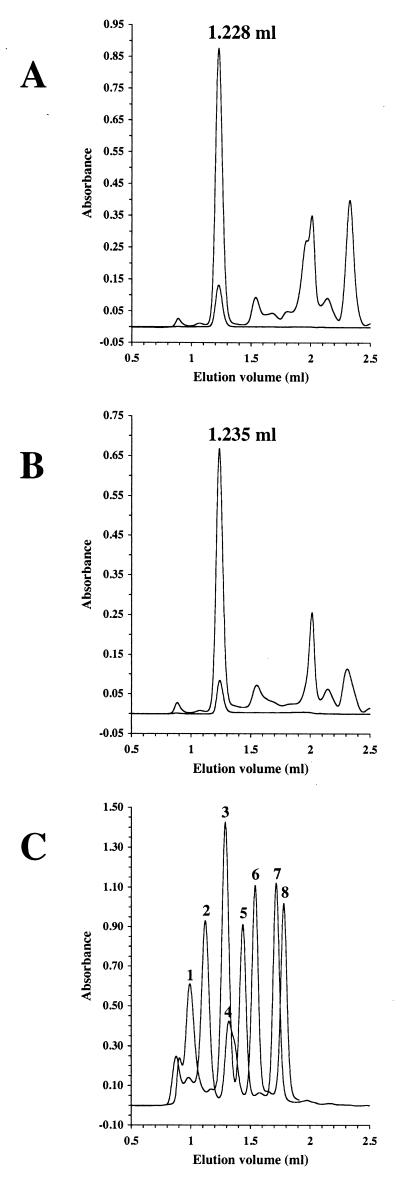
FIG. 3.
Gel filtration of MrsD and MrsD H75N. HiTrap Q-enriched MrsD (A) and MrsD H75N (B) proteins were separated by gel filtration, and the elution was followed by measuring the absorbance at 280 nm (upper line), 378 nm (not shown), and 450 nm (lower line). The proteins eluted at 1.228 and 1.235 ml, respectively, corresponding to apparent molecular masses of ca. 236.9 and 228.8 kDa. The elution volume was not changed by preincubation of MrsD with 10 mM DTT for 15 min at room temperature. (C) Calibration of Superdex 200 PC3.2/30 column. To correlate the elution volume with molecular mass information, the elution volumes of standard proteins (thyroglobulin [peak 1, 669 kDa, 0.992 ml], ferritin [peak 2, 440 kDa, 1.121 ml], catalase [peak 3, 232 kDa, 1.287 ml], aldolase [peak 4, 158 kDa, 1.320 ml], albumin [peak 5, 67 kDa, 1.436 ml], ovalbumin [peak 6, 43 kDa, 1.539 ml], chymotrypsinogen A [peak 7, 25 kDa, 1.714 ml], and RNase [peak 8, 13.7 kDa, 1.779 ml]) were determined. The void volume of the column was determined to be 0.933 ml by using dextran blue 2000.

