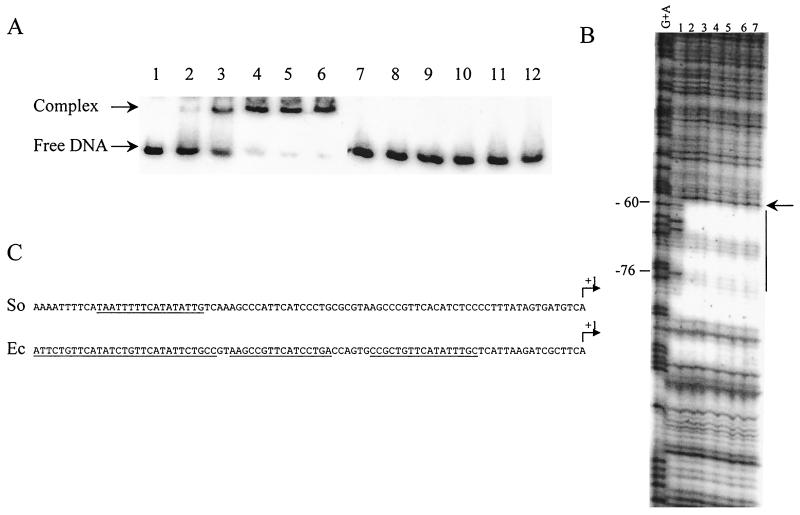
FIG. 3.
Analysis of TorR binding to the torE promoter region by band shift assays (A) and DNase I footprinting experiments (B). (A) Labeled DNA fragments containing the torE region from positions −84 to +119 (lanes 1 to 6) or from −60 to +119 (lanes 7 to 12) were incubated in the presence of the following concentrations of purified TorR protein: lanes 1 and 7, no protein; lanes 2 and 8, 0.05 μM; lanes 3 and 9, 0.25 μM; lanes 4 and 10, 0.5 μM; lanes 5 and 11, 1 μM; and lanes 6 and 12, 2.5 μM. (B) The labeled DNA fragment was prepared by PCR using sense 32P-end-labeled and reverse unlabeled primers and plasmid pPTorso7 as the template. The fragment was digested with 0.33 U of DNase I in the presence of various concentrations of purified TorRso protein: lane 1, no protein; lane 2, 0.25 μM; lane 3, 0.5 μM; lane 4, 1 μM; lane 5, 2.5 μM; lane 6, 5 μM; and lane 7, 10 μM. The G+A sequencing ladder is indicated. Numbering is relative to the transcription start site. Vertical bar indicates the protected region, and the arrow shows a DNase I-hypersensitive site. (C) Nucleotide sequences of the S. oneidensis (So) and E. coli (Ec) tor promoters. The regions protected by TorRso or TorRec are underlined, and transcription start sites are indicated by arrows labeled +1.

