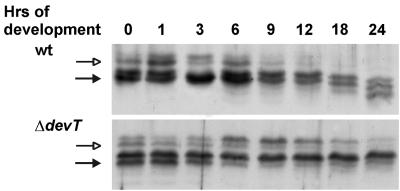
FIG. 3.
Immunoblot analyses of the FrzCD methylation patterns in wt and ΔdevT cells. Total cell lysates were prepared from cells after exposure to starvation in submerged culture for the indicated periods of time and reacted with anti-FrzCD antibody. (Top) Proteins isolated from DK1622 (wt) cells; (bottom) proteins isolated from DK11207(ΔdevT) cells. The two upper bands represent nonmethylated FrzCD (indicated by the open arrows), and the four lower bands represent methylated FrzCD (indicated by the solid arrows). Protein from 5 × 10⁷ cells was added to each lane.

