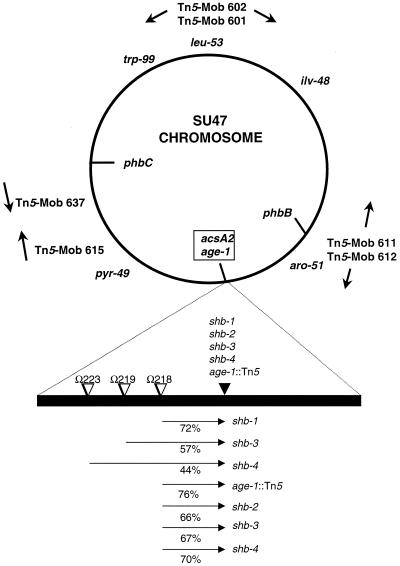
FIG. 2.
Genetic map of the S. meliloti chromosome, showing the locations of the acsA2 gene, required for utilization of AA, and age-1, an insertion in which results in an increased growth rate on AA and HB. Arrows indicate positions and orientations of Tn5-mob insertions. The positions of the auxotrophic markers are from the genetic map of the chromosome (17). The positions of the mapped loci are approximate and are based on conjugation and transduction linkage data (8). The relative order of the Tn5-233 insertions and the suppressor alleles depicted is arbitrary. Cotransduction frequencies are given as percentages below the arrows. The tail of each arrow indicates the donor marker and the head represents the recipient in transduction.

