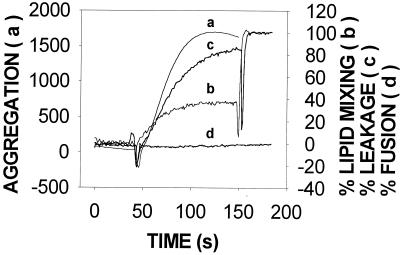
FIG. 3.
Effects of TrwD on SUV stability. Curve a shows vesicle aggregation, which was assayed as an increase in light scattering (520 nm) by the suspension. Curve b shows intervesicular lipid mixing, which was measured by dilution in the bilayer of self-quenching probe R18. The excitation and emission wavelengths were, respectively, 560 and 590 nm. Curve c shows release of vesicular aqueous contents, which was estimated with the ANTS/DPX fluorescent probe system. The excitation and emission wavelengths were, respectively, 355 and 520 nm. Curve d shows intervesicular mixing of aqueous contents, which was also measured with the ANTS/DPX system. In all cases, SUV composed of PC-CL at a 1:1 molar ratio were used. Phospholipid and protein concentrations were, respectively,0.2 mM and 17 nM.

