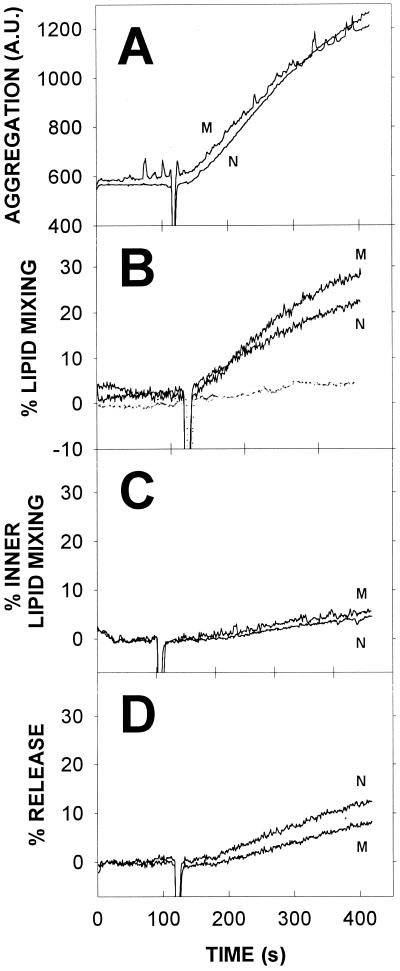
FIG. 4.
Effects of TrwD on LUV stability. (A) Vesicle aggregation measured as light scattering (520 nm). (B) Intervesicular lipid mixing measured by the R18 method (continuous line) and intervesicular mixing of aqueous contents (dotted line) measured as described in the legend to Fig. 3C. (C) Intervesicular mixing of inner monolayer lipids measured as described by McIntyre and Sleight (25) with NBD-PE and rhodamine-PE. (D) Release of vesicular aqueous contents measured as described in the legend to Fig. 3. Phospholipid and protein concentrations were as described in the legend to Fig. 3. N and M refer to the native and mutant forms of TrwD, respectively.

