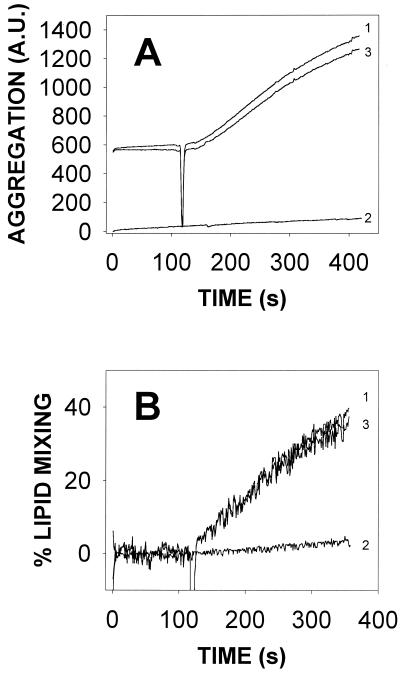
FIG. 5.
Influence of spontaneous aggregation and lipid mixing in LUV consisting of CL-PC at a 1:1 ratio. The lipid concentration was 0.2 mM. Panels: A, vesicle aggregation; B, intervesicular lipid mixing. Curves: 1, experimentally observed effect upon addition of 17 nM TrwD; 2, experimentally observed effect upon mixing of the vesicles with a buffer containing 10 mM calcium in the absence of protein; 3, difference (curve 1 minus curve 2). Curve 3 is an example of the corrected signals depicted in Fig. 1 to 4. A.U., arbitrary units.

