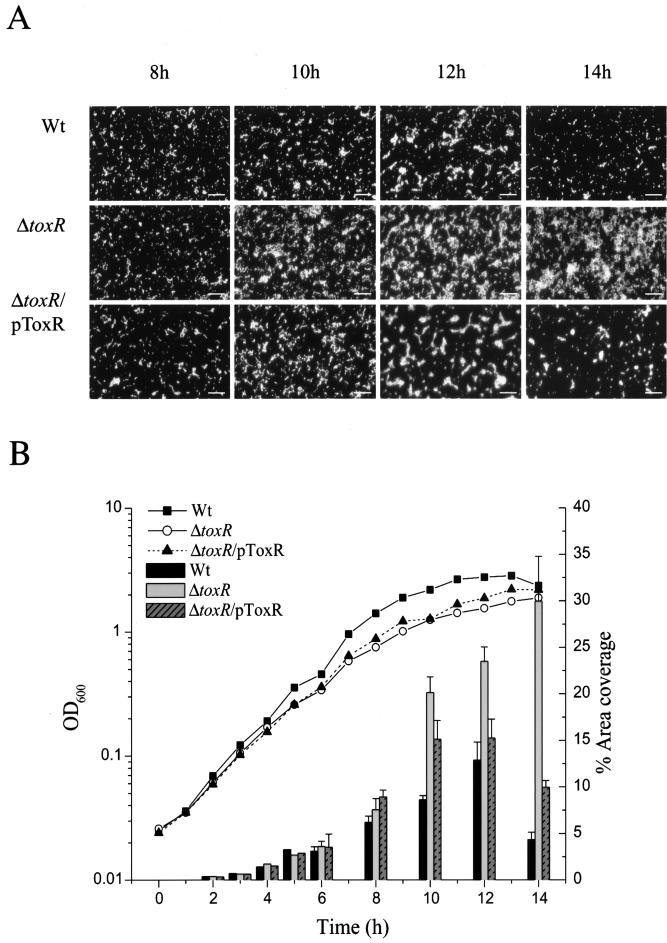
FIG. 5.
Percent area coverage of a biofilm on a glass surface for the wild type (Wt, NB10), the toxR mutant (SY10), and the complemented toxR mutant (SY10/pToxR). (A) Typical view of the progression of biofilm formation for each strain at 8 h, 10 h, 12 h, and 14 h. Slides were stained with acridine orange and then viewed with a fluorescent microscope. Bar, 20 μm. (B) Biofilm formation was quantified by determining the percent area coverage on a glass slide. For each strain, five images were taken at each time point and saved as a computer image. These images were converted into black (background) and white (biofilm) pixels using the Image Tool software, version 2, and the percentage of white pixels is given as the percentage of biofilm covering the glass surface. The data for 2 h, 3 h, 4 h, and 5 h were done as separate experiments from those for 8 h, 10 h, 12 h, and 14 h but are included in the same figure for easy comparison. The data shown are from one experiment. All percent area coverage experiments were done at least three times, and they all gave similar results.

