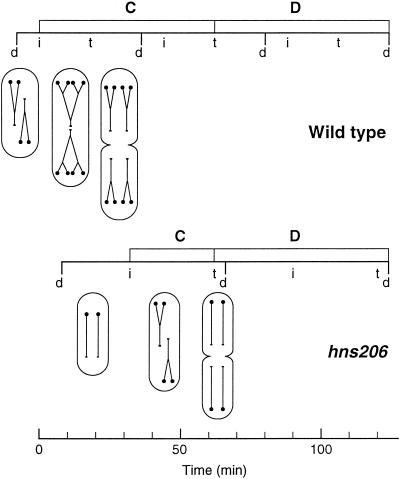
FIG. 3.
Schematic representation of the cell cycles in wild type and hns206 mutant at 30°C as a function of time. Nonreplicating chromosomes are drawn as lines with the small circle symbolizing the origin. Replicating chromosomes are shown as forked or multiforked lines. Cell mass is reflected in the relative size of the cells assuming that the difference between wild type and mutant leads to proportional changes in width and length. Division (d), initiation (i), and termination (t) are indicated along the line representing the successive cycles.

