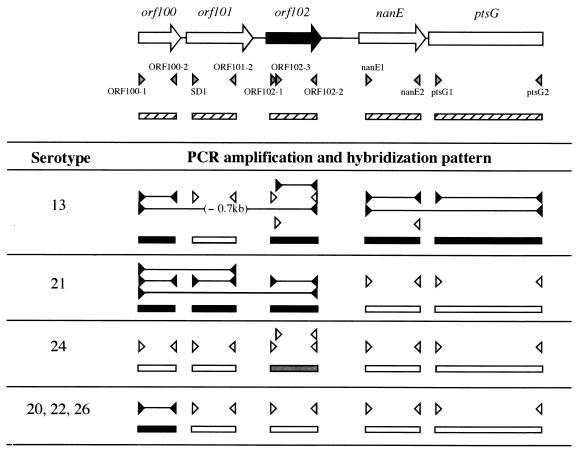
FIG. 3.
Schematic representations of the results of systematic PCR and Southern hybridization analyses of atypical-type reference strains. Positions of primers and probes used relative to the DAT1-type genetic organization are indicated at the top by gray arrowheads and hatched boxes, respectively. orf100, orf101, orf102, nanE, and ptsG probes were amplified by PCR from the genomic DNA of strain DAT1 with primers ORF100-1 and ORF100-2, SD1 and ORF101-2, ORF102-1 and ORF102-2, nanE1 and nanE2, and ptsG1 and ptsG2, respectively. The genomic DNAs of the six reference strains were digested with PstI and XhoI. Solid lines between the closed arrowheads, regions amplified by PCR; open arrowheads facing each other, primers that did not amplify any PCR fragment; closed and gray boxes, probes that gave strong and weak hybridization signals, respectively; open boxes, probes that did not give any hybridization signals. When the length of the amplified fragment was different from that expected from the sequence of DAT1, the size difference is indicated in parentheses.

