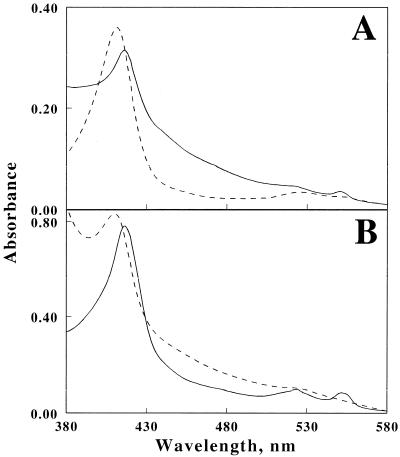
FIG. 5.
Redox response of the cytochrome in cell extract and Fe3+. (A) Absorbance spectra of the crude extract of the cells grown on H2/Fe3+(solid line) and the oxidized form of the purified cytochrome (dashed line). (B) Absorbance spectra of the mixture containing the crude extract and the oxidized form of the purified cytochrome with (dashed line) or without (solid line) Fe3+.

