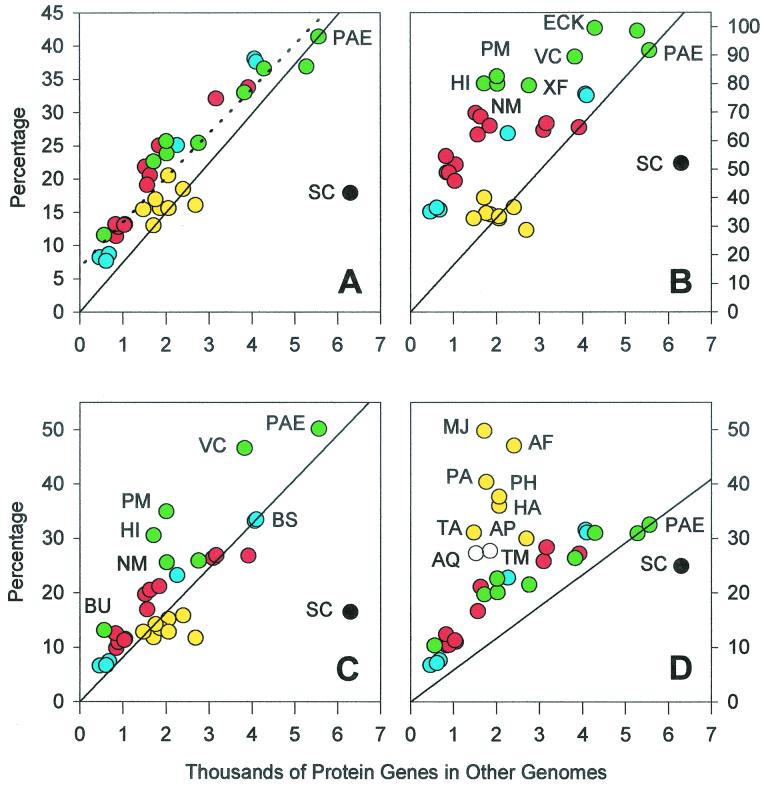
FIG. 3.
Relationship between gene content and genome size. First, the numbers of orthologous genes in Fig. 1 were divided by the numbers of genes in Table 1, resulting in the percentage of orthologous genes shown in Fig. 2. The percentage of orthologous genes of the first genome of a species pair were then plotted versus the total number of genes in the second genome of the pair for 35 comparisons (because of its exceptionally large size, C. elegans was excluded for clarity). (A) Percentage of D. radiodurans genes in other genomes; (B) percentage of Buchnera sp. genes in other genomes; (C) percentage of E. coli genes in other genomes; (D) percentage of Methanobacterium thermoautotrophicus genes in other genomes. The dotted line is a fit to the data, whereas the solid lines arbitrarily connect the origin to either B. subtilis or P. aeruginosa. The archaebacteria are yellow, the related gram-positive species are blue, the related gram-negative species are green, yeast is black, and the remaining species are red. The two bacteria which appear to be related to the archaea in plot D are shown as open circles.

