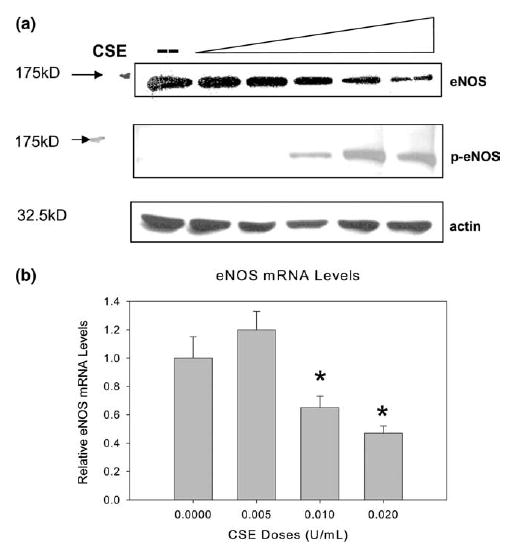
Fig. 2.

CSE causes dose-dependent change in eNOS protein and mRNA level. (a) Western blot of the eNOS protein levels in HAECs treated with CSE at doses of 0, 0.005, 0.001, 0.015, 0.02, and 0.025 U (lanes 1–6) for 24 h. Twenty-five micrograms of cellular protein was separated by 8% SDS–PAGE and blotted with anti-eNOS antibody and anti-phospho eNOS (Ser1177). Experiments were repeated three times and the representative electrophoresis is shown in the figure. (b) HAECs treated with CSE showed dose-dependent changes in eNOS mRNA level (means + S.E.M., N = 3) measured by quantitative real-time RT-PCR and expressed as relative units comparing to control cells. HAECs were treated with indicated doses of CSE for 24 h. House keeping gene β-actin mRNA was used as internal control. Among group difference was statistically significant (P < 0.01) by ANOVA test; *P < 0.01 by the post hoc Dunnet’s test when compared with control cells treated with the standard medium only.
