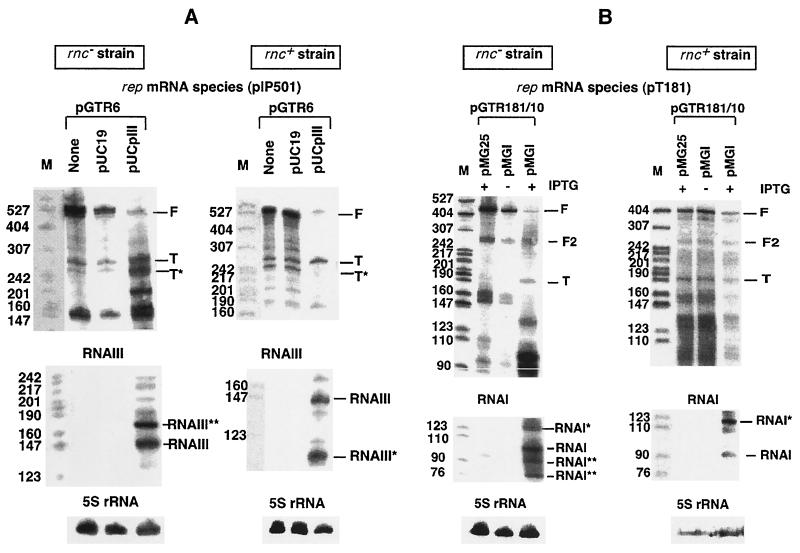
FIG. 2.
In vivo attenuation patterns in E. coli. An analysis of RNAs encoded by the control region of pIP501 (A) and a corresponding analysis of pT181 (B) are shown. The top portions of both panels show autoradiograms obtained after hybridization with labeled cognate antisense RNAs as probes (RNAIII for pIP501 and RNAI for pT181). The middle portions are autoradiograms from reprobing the same membranes with labeled sense RNAs. The bottom portions are loading controls (hybridized with a probe against 5S rRNA). (A) pGTR6 carries an antisense RNA promoter down-mutation. Lanes none, no antisense RNA donor plasmid present; lanes pUC19, empty vector; lanes pUCpIII, pUC19 derivative providing RNAIII in trans. F and T, positions of full-length (terminated at the rrnB terminator) and prematurely terminated sense RNA (terminated at the attenuator), respectively. T*, processed form of T (see Results). (B) Both pGTR181/10 and pGTR181/35 carry antisense RNA promoter down-mutations. Lanes pMG25, insertless vector; lanes pMGI, pMG25 derivative providing RNAI in trans. Cultures were treated with IPTG for induction of antisense RNA transcription (+) or were not treated with IPTG (−) (see Materials and Methods). RNAI*, RNAI**, RNAIII*, and RNAIII** are discussed in the text. The band corresponding to F2 has its 3′ end at the 5′ side of the rrnB sequence. M, pBR322 MspI marker.

