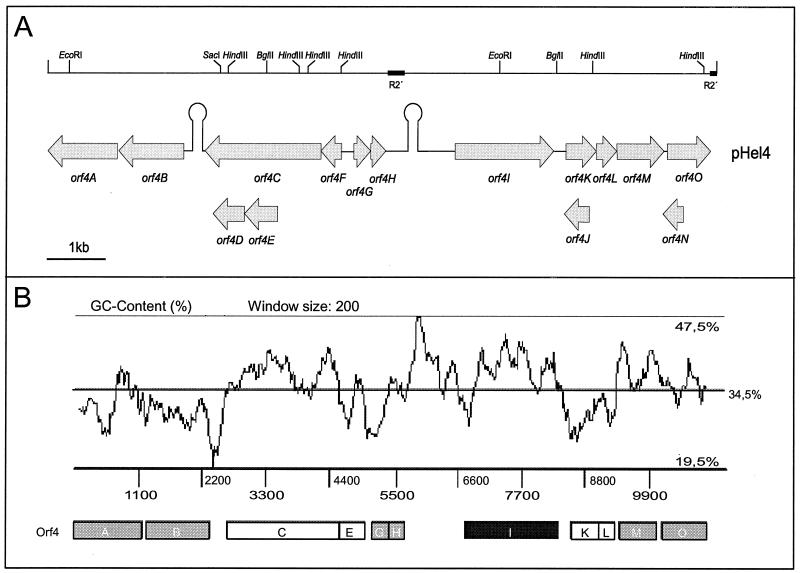
FIG. 2.
Physical and genetic map and graphic display of the G+C content of plasmid pHel4. (A) The restriction map (top), as deduced from the plasmid sequence, for BglII, EcoRI, HindIII, and SacI corresponds to the restriction digestion in Fig. 1. The location and orientation of putative ORFs in pHel4 as well as putative terminator sequences (Ω-like symbols), as determined by computer program TERMINATOR, are given below. (B) G+C content plotted over the whole plasmid sequence by using the computer program ARTEMIS. Black box, ORF encoding RepA; grey boxes, putative ORFs with homology to the H. pylori chromosome; white boxes, other putative genes.

