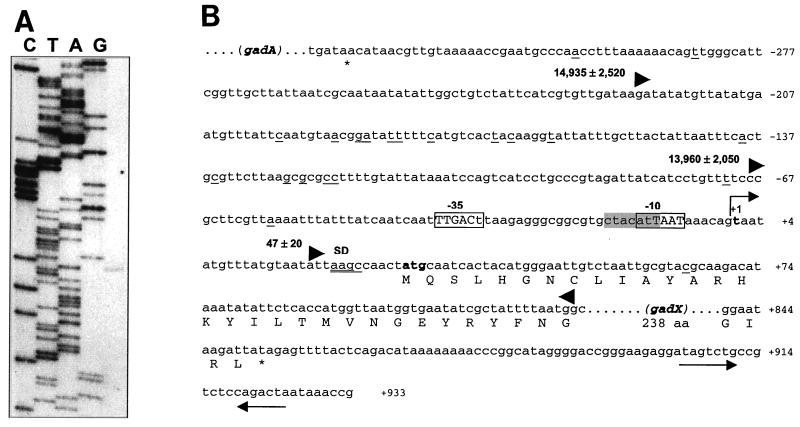
FIG. 4.
Promoter mapping and location of the transcription start point of gadX. (A) Mapping of the 5′ end of the gadX transcript by primer extension. RNA was extracted from stationary-phase cells grown at pH 5.5 and retrotranscribed after priming with a 5′-end-labeled oligonucleotide. Lanes C, T, A, and G are sequencing ladders of pBsAX with the same oligonucleotide used for the primer extension reaction. Sequencing reactions were run in parallel with the cDNA transcript (right lane) to determine exactly the 5′ end of the gadX message. (B) Sequence analysis of the gadX promoter region in E. coli ATCC 11246. The bent arrow indicates the transcriptional start site at the residue in bold, defined as +1. Differences from the E. coli RpoD consensus sequences for the −10 and −35 promoter elements are shown as lowercase letters within the boxed regions. The RpoS consensus is shaded in gray. Nucleotide sequence variations between ATCC 11246 and the K-12 strain MG1655 (4) are underlined. The potential Shine-Dalgarno (SD) sequence is double underlined. The triangles define the 5′-to-3′ boundaries of the DNA fragments tested for the ability to direct lacZ expression in pRS415 (32). The number preceding each forward-pointing triangle is the β-galactosidase activity value (in Miller units) expressed by exponential-phase cultures of E. coli MC4100 carrying the cloned promoter fragment. Sequence numbering is relative to the gadX transcription start point.

