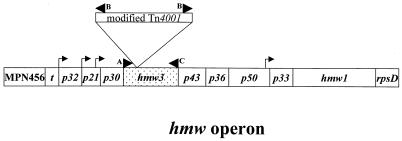
FIG. 2.
Schematic of the hmw operon (10, 37) illustrating the point of insertion of the transposon into hmw3 (shaded for emphasis). Arrowheads indicate the positions of the primers used for PCR analysis. Arrows indicate the positions of the promoters within the operon. Insertion of the transposon immediately downstream of nucleotide 267 was determined by sequencing the PCR product generated using primer pair A-B. The diagram is not drawn to scale.

