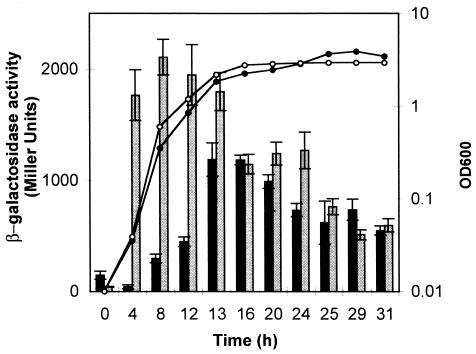
FIG. 1.
Time course of expression of the phl operon. The transcriptional fusions phlACBD-lacZ (pCU107) and phlF-lacZ (pCU109) were introduced into P. fluorescens F113. Cultures were grown on minimal medium, and absorbance was measured at 600 nm (solid circles, phlF-lacZ; open circles, phlACBD-lacZ). Expression of the fusions was assessed by measuring levels of β-galactosidase. Grey shading represents phlF-lacZ expression, and dark shading represents phlACBD-lacZ expression. Triplicate cultures were assayed. The standard deviations are represented with error bars.

