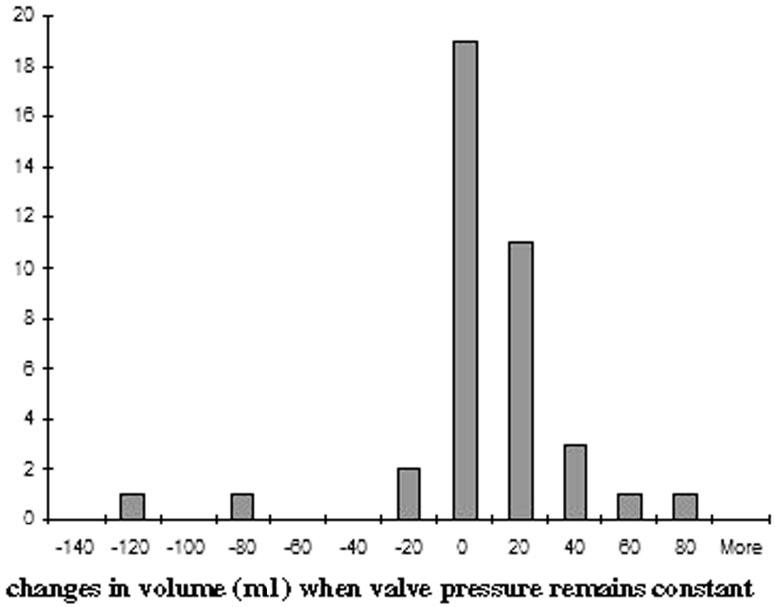
FIGURE 4.

Frequency distribution curve illustrating the number of times across all subjects that ventricular volume was observed to either increase or decrease when the adjustable valve pressure remained constant. This bar graph illustrates the variability in ventricular volume at a given pressure, but it also illustrates that the majority of these variations in volume at a constant pressure are very small, between 0 and 20 ml.
