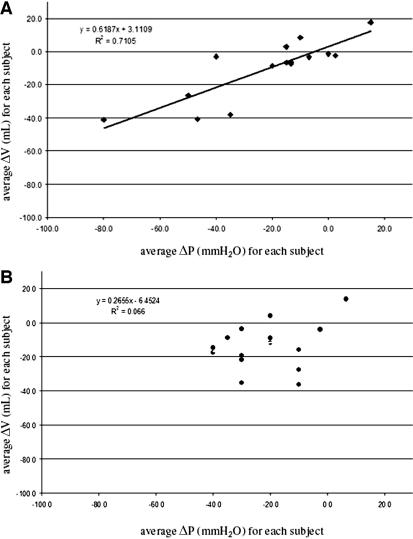
FIGURE 5.
A , diagram plotting the average changes in ventricular volume (ΔV) for the corresponding changes in valve pressure setting (ΔP ) for those patients who experienced 100% clinical improvement. B , diagram plotting the average changes in ventricular volume (ΔV ) for the corresponding changes in valve pressure setting (ΔP ) for those patients who experienced only partial clinical improvement in presenting symptoms.

