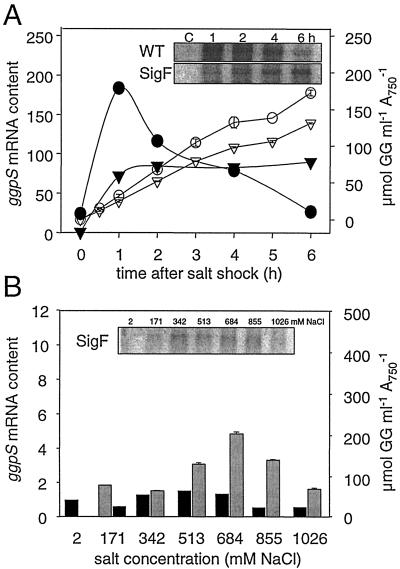
FIG. 6.
Comparison of salt-dependent ggpS expression and GG accumulation in cells of the Synechocystis wild type (WT) or a σF mutant (SigF) after a salt shock (A) or complete acclimation to different salt concentrations (B). (A) Changes in the ggpS mRNA steady-state contents after densitometric evaluation (solid symbols) and GG content (open symbols) after salt shock consisting of 684 mM NaCl for cells of the wild type (circles) or the σF mutant (triangles). Signals for ggpS mRNA obtained by Northern blot analysis are shown in the insets. (B) Changes in the ggpS mRNA steady-state content (solid bars) and the amount of accumulated GG (grey bars) in cells of the σF mutant completely acclimated to different salt concentrations. Signals for ggpS mRNA obtained by Northern blot analysis are shown in the inset (compare to Fig. 2).

