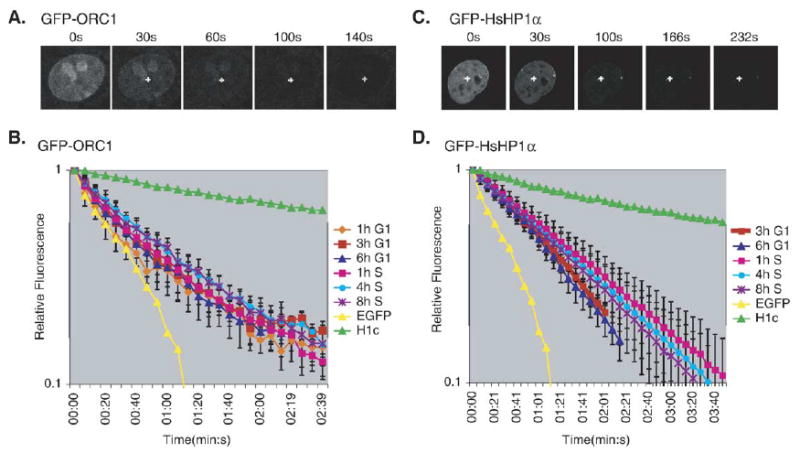
Fig. 4.

FLIP of GFP-CgORC1 and GFP-HP1α, corrected for nuclear volume. (A) FLIP analysis of GFP-CgORC1 during the cell-cycle. GFP-CgORC1 expressing cells were subjected to a repeating cycle of an image scan, a 0.5 s bleach pulse at 100% laser power and a 5 s recovery period. The images are from a typical FLIP experiment showing the loss of GFP fluorescence over time as a result of the repeated bleach pulse (indicated by the cross). (B) FLIP kinetic plot of GFP-CgORC1 fluorescence loss as a function of time. Each line represents the average fluorescence loss from at least 5 cells, with the loss quantified at 2–3 distinct sites within the nucleus of each cell, at the indicated times during the cell-cycle. The error bars indicate the standard deviation among the individual measurements for each timepoint. Similar results were obtained in three independent experiments. Results with EGFP and histone H1c are provided as reference marks for in vivo protein mobility. (C) FLIP analysis of a stable CHO cell line expressing GFP-HP1α, performed as in panel (A). (D) FLIP kinetic plot for GFP-HP1α during the cell-cycle. Data are displayed as in panel (B). Similar results were obtained in three independent experiments.
