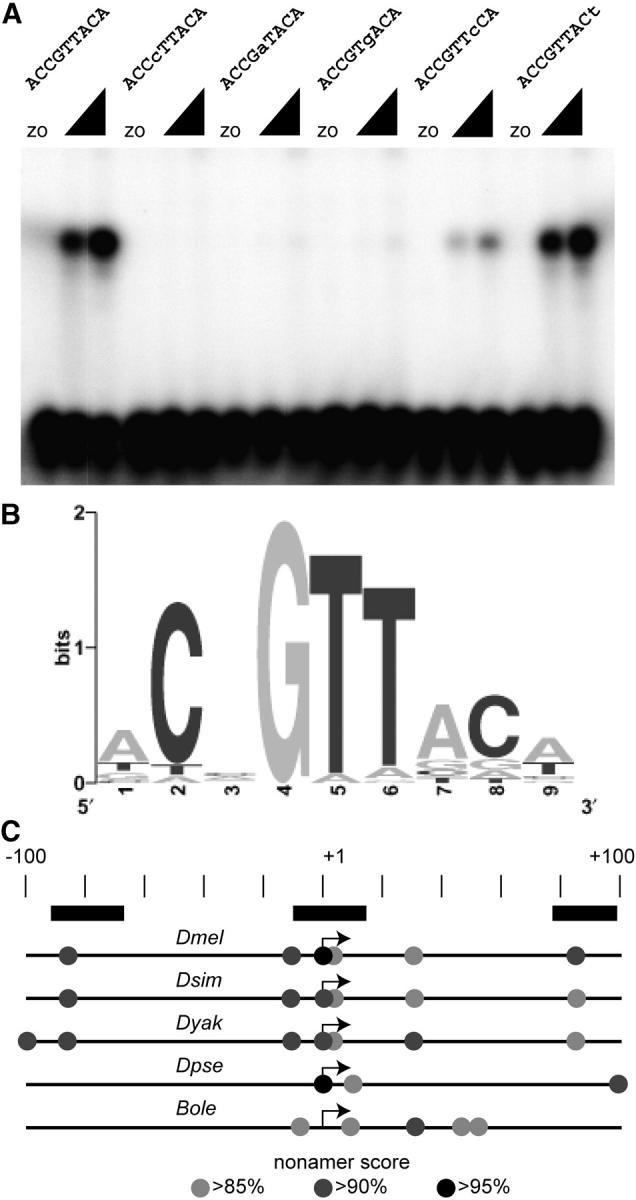
Figure 5.—

OVO binding sites. (A) Examples of gel shifts used to test for binding activity of mutated strong OVO binding sites. The sequences of the binding sites are shown. Altered residues are in lowercase type. Two concentrations of OVO DNA-binding domain were used as well as extracts from bacteria expressing a control transcript (zo). (B) Sequence Logo showing the refined OVO binding site model. (C) The position of potential OVO binding sites in D. melanogaster (Dmel), D. simulans (Dsim), D. yakuba (Dyak), D. pseudoobscura (Dpse), and B. oleae (Bole) relative to the known (Dmel and Bole) or predicted ovo-B transcription start site (scale in base pairs shown). Nonamer scores are indicated by shading (see key). The extent of OVO footprints in D. melanogaster is shown (solid rectangles).
