
Fig. 7.
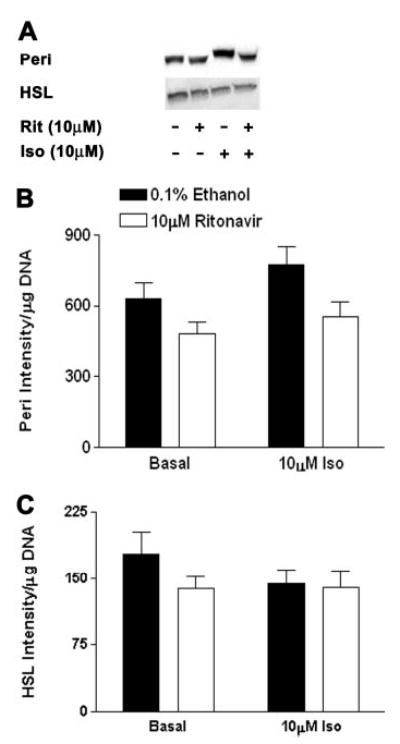
Peri and HSL protein expression in 3T3-L1 adipocytes treated with ritonavir for 14 d. Whole-cell lysates were collected from cells treated with 10 μm Iso or medium alone for 2 h at 37 C, and blotted as specified in Materials and Methods. A, Representative Western blots; B, quantitation of signal intensity from Western blots for Peri; C, HSL; n = 13–15 from three independent experiments. For Peri, P < 0.01 for ritonavir vs. ethanol groups; for HSL, no significant differences.