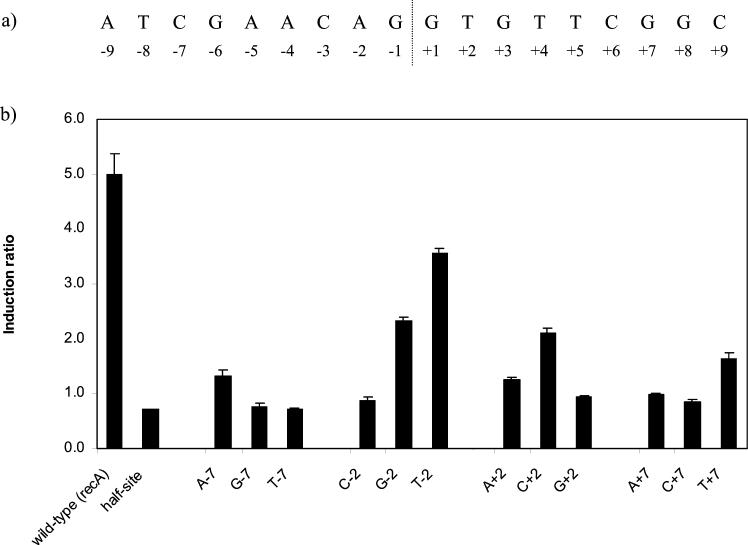
FIG. 2.
(a) The sequence of the recA SOS box along with the numbering system used to identify individual bases. (b) The effect of single base changes at ±2 and ±7 on the induction ratio. The base tested and its position is indicated below each bar. The wild-type sequence was the recA SOS box shown in panel a, and the half site consisted of four base changes from GAAC to TGGA. The graph shows the mean values obtained from duplicate assays of at least three independent inductions.

