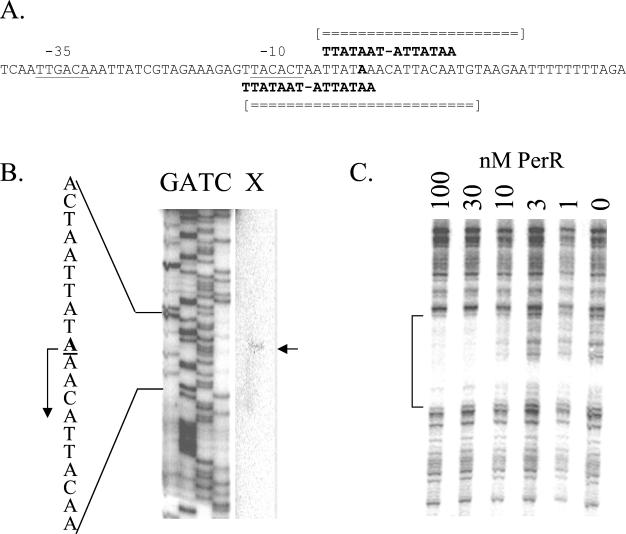
FIG. 1.
Interaction of PerR with the perR regulatory region. (A) The −35 and −10 regions of the perR promoter are underlined, and the two overlapping Per box elements are indicated. The A residue start site for transcription is in bold. Regions of both DNA strands protected against DNase I digestion by bound PerR protein are indicated by broken double lines. (B) Primer extension mapping of the perR transcriptional start site (arrow) indicates transcript initiation with the A residue indicated in the sequence to the left. (C) DNase I footprint of purified PerR binding to the perR promoter. PerR was added at the concentrations (nanomolar) indicated in the presence of 10 μM Mn(II). Shown are results from footprinting on the bottom strand; however, top-strand analysis was also performed (data not shown). The regions protected against digestion, as determined by alignment with G+A sequencing ladders (data not shown), are summarized in panel A.

