
FIG. 2.
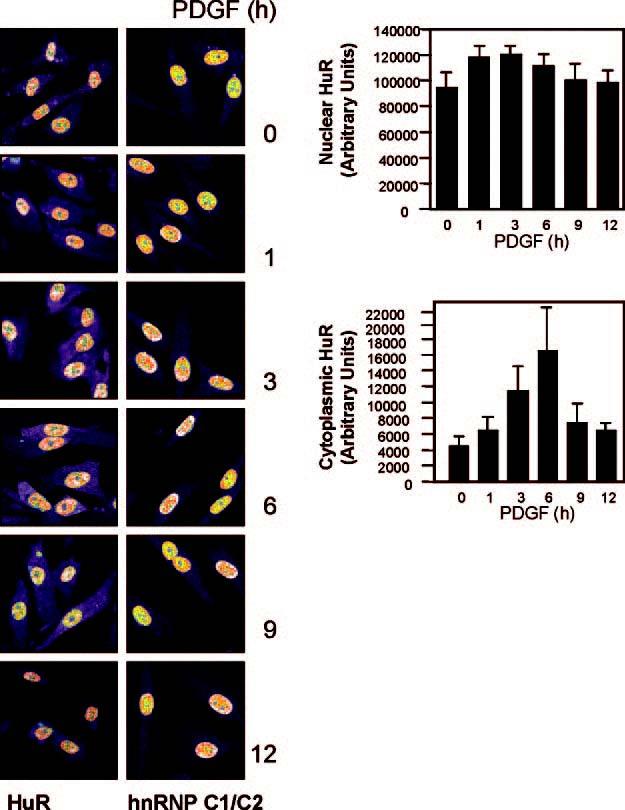
Left, subcellular distribution of HuR in hVSMCs as detected by immunofluorescence at the times shown after stimulation with 10 ng/ml PDGF. Control heterogeneous nuclear ribonucleoprotein C1/C2 (hnRNP C1/C2), also detected by immunofluorescence, remained in the nucleus throughout the treatment. Right, quantitation of HuR immunofluorescent signals; data represent the means ± S.E. from three independent experiments. Significant differences (p < 0.05) were found at 3 and 6 h.