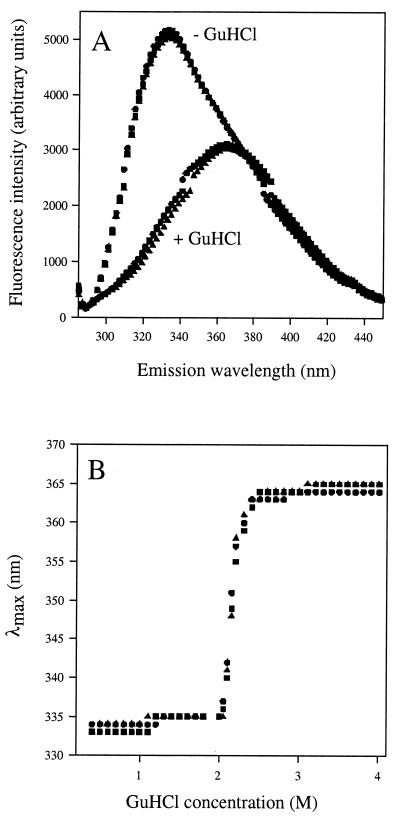
FIG. 4.
Equilibrium unfolding transitions by GuHCl. (A) Fluorescence emission spectra for wild-type (•), D460T-D462N (▴), and E576A-E578A (▪) OpdB mutant proteins. Each enzyme was 25 μg · ml−1 in 50 mM Tris-HCl, pH 8. Spectra were recorded using an excitation wavelength of 278 nm, in the presence (+ GuHCl) and absence (− GuHCl) of 4 M GuHCl. (B) Changes in the λmax of the emission spectra of OpdB wild-type and mutant proteins as a function of denaturant concentration.

