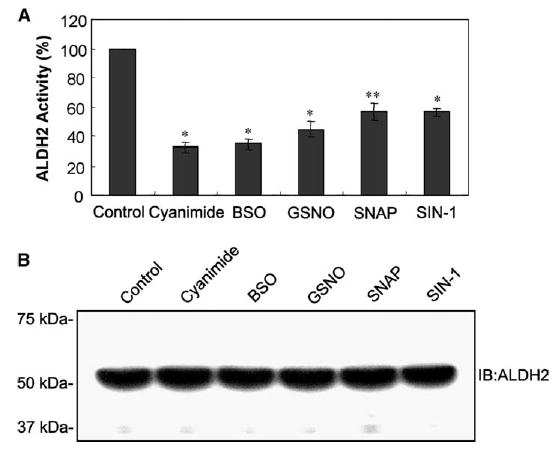
Fig. 2.

Inactivation of ALDH2 by various compounds including NO donors. (A) H4IIE-C3 cells were exposed to various agents: 1 mM cyanamide, 10 mM BSO, 0.5 mM GSNO, 1.0 mM SNAP, or 1.0 mM SIN-1 for 4 h, before cells were harvested. Mitochondrial proteins (0.5 mg/assay) were used to measure the ALDH2 activity. ALDH2 activity in each sample is compared to that of the untreated control. Each point represents the average ± S.D. of three determinations. * and **Significant difference (*P < 0.005 and **P < 0.01) from the control sample. (B) Equal amounts of mitochondrial proteins (20 μg/well) from the same set of samples were separated on 12% SDS–PAGE and subjected to immunoblot analysis using the anti-ALDH2 antibody. Migration of molecular weight marker proteins is shown in the left.
