
Figure 3.
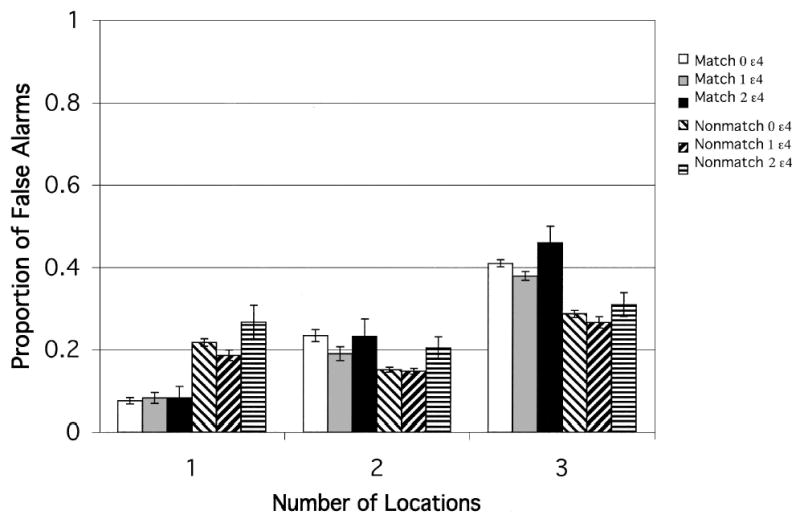
Experiment 2: Match and nonmatch conditions. Proportion of false alarms after a 3-s delay for each ɛ4 gene dose group, plotted as a function of memory load (number of locations to be retained). Error bars represent standard errors.
Official websites use .gov
A
.gov website belongs to an official
government organization in the United States.
Secure .gov websites use HTTPS
A lock (
) or https:// means you've safely
connected to the .gov website. Share sensitive
information only on official, secure websites.
Experiment 2: Match and nonmatch conditions. Proportion of false alarms after a 3-s delay for each ɛ4 gene dose group, plotted as a function of memory load (number of locations to be retained). Error bars represent standard errors.