
Figure 7.
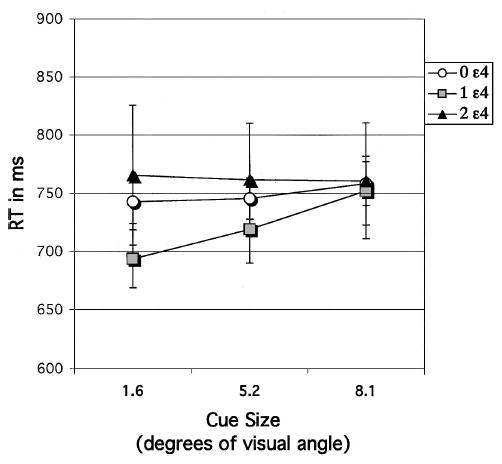
Experiment 3: Match condition. Reaction time (RT) of decision about target location following a 3-s delay, plotted as a function of cue size (1.6, 5.2, or 8.1) to target location for each apolipoprotein E–ɛ4 gene dose group. Error bars represent standard errors.