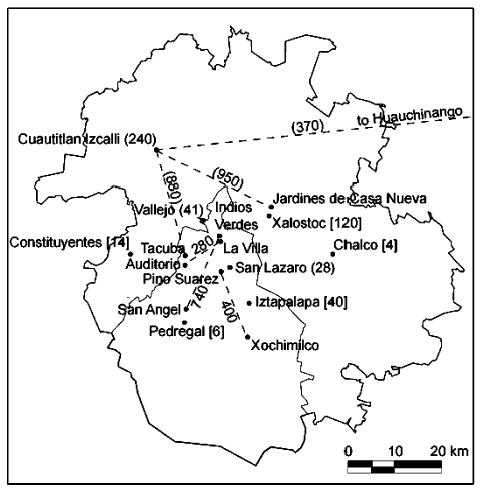
FIGURE 1.

Map showing measurement locations in the Mexico City metropolitan area and arithmetic mean 9 a.m. to 12 p.m. ambient TPAH concentrations at fixed locations and along routes between locations (shown along dashed lines). Measurements from the diesel exposure study in October 2002 are shown in parentheses. Those from the commuter study in June to July 2002 are plain numbers, and those from the mobile laboratory study in February 2002 are shown in brackets. The interior boundary represents the limits of the Federal District.
