FIGURE 2.

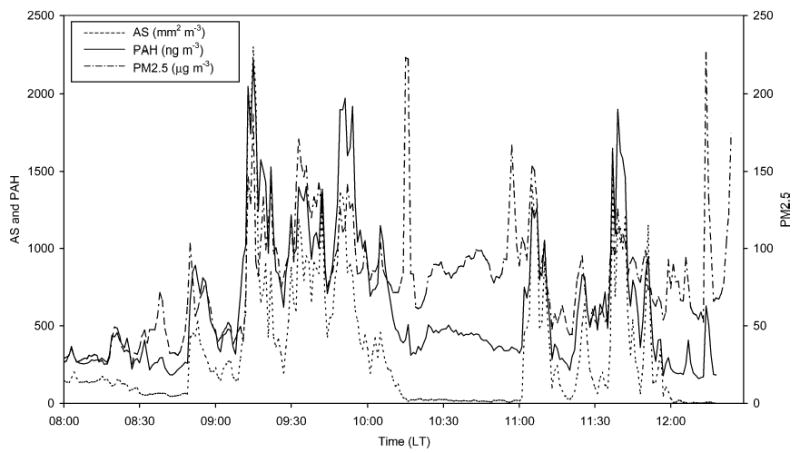
Time series showing active surface, TPAH, and PM2.5 concentrations during the truck trip between Cuautitlán Izcalli and Tacuba. The truck was parked at a warehouse between approximately 10:15 and 11:00 a.m.

Time series showing active surface, TPAH, and PM2.5 concentrations during the truck trip between Cuautitlán Izcalli and Tacuba. The truck was parked at a warehouse between approximately 10:15 and 11:00 a.m.