FIGURE 3.

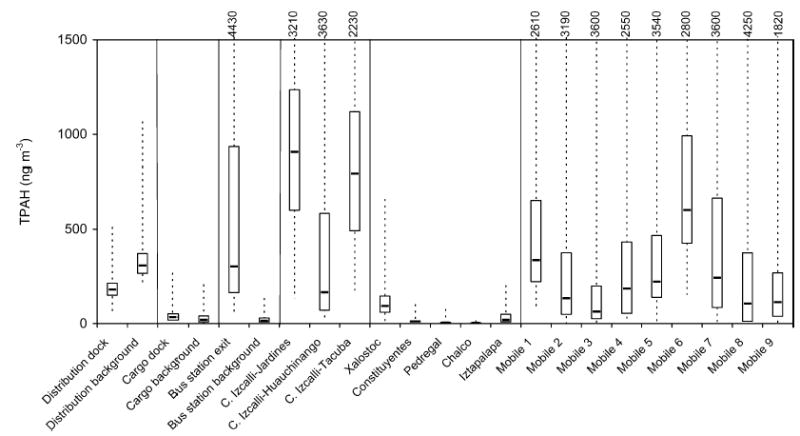
Box plots showing the minimum, 25th percentile, median, 75th percentile, and maximum TPAH concentrations measured during the diesel exposure and mobile laboratory experiments.

Box plots showing the minimum, 25th percentile, median, 75th percentile, and maximum TPAH concentrations measured during the diesel exposure and mobile laboratory experiments.