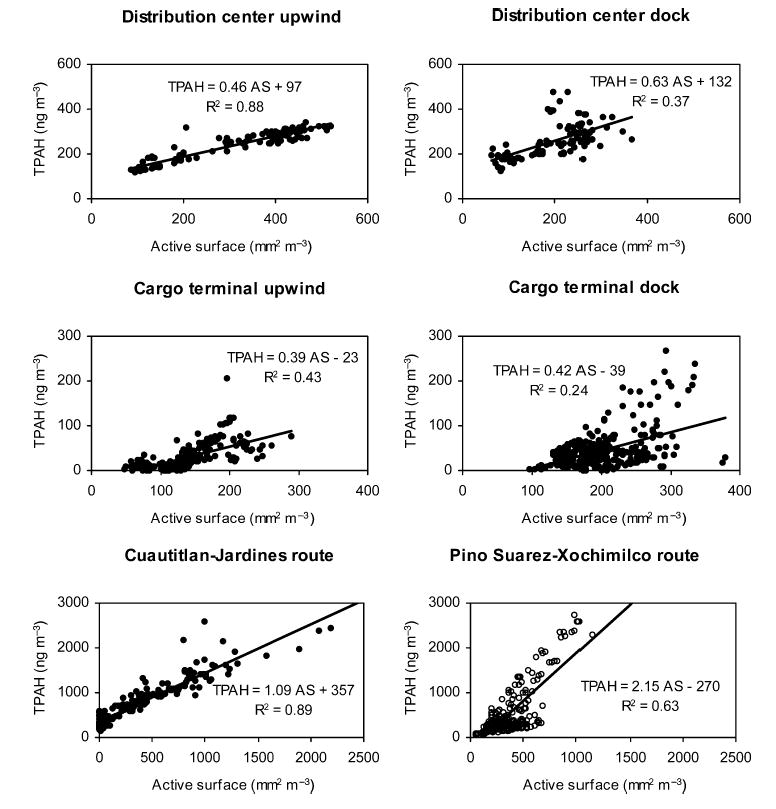
FIGURE 5.

TPAH vs active surface (AS) area concentrations upwind and in the loading dock area of two diesel truck terminals and along two roadway routes. Solid and open circles represent data collected in October and June 2002, respectively. The Cuautitlán Izcalli–Jardines route was monitored on October 22, 2002, from inside a diesel truck cab, and the Pino Suarez–Xochimilco route was monitored during the morning commute on June 20 and 21, 2002, from inside an automobile.
