Fig. 3.

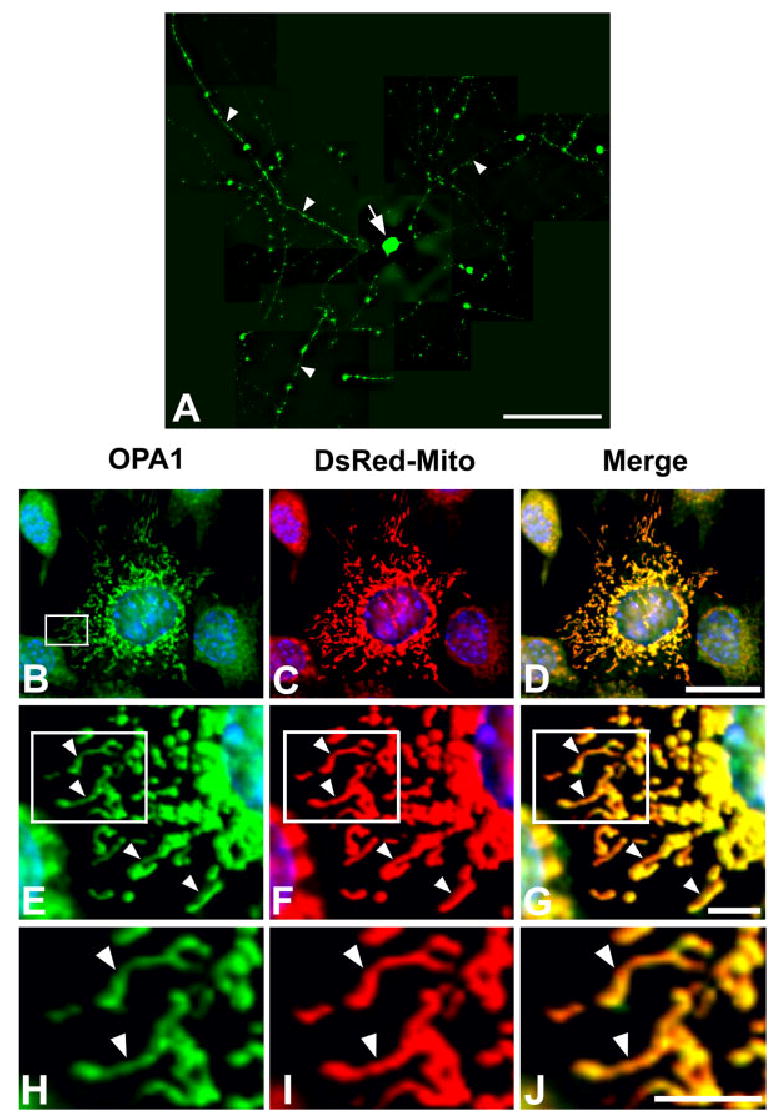
OPA1 immunoreactivity in cultured retinal ganglion cells and RGC-5 cells. A: OPA1 immunocytochemistry. OPA1-IR was present at high levels in the processes (arrowheads) and cell body (arrow) in a retinal ganglion cell. B–J: OPA1 (B,E,H) and DsRed2-Mito (C,F,I) double labeling. Higher magnification shows that OPA1 was present in DsRed-Mito-labeled mitochondria with long tubular forms in RGC-5 cells (merge, D,G,J; arrowheads). Scale bars = 100 μm in A; 20 μm in D (applies to B–D); 10 μm in G (applies to G–E), J (applies to H–J).
