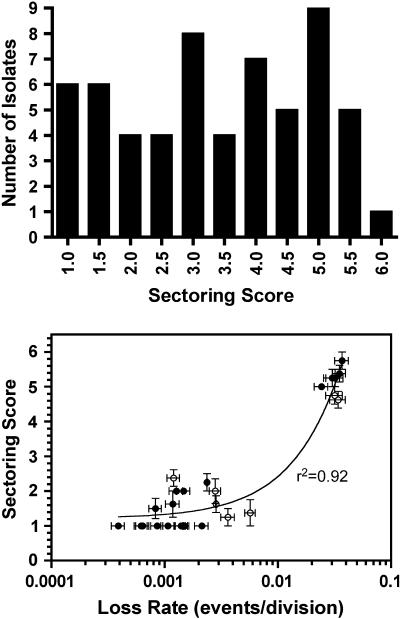
Figure 4.
Histogram of sectoring scores determined for randomly picked transformants carrying replacement centromeres from the randomized CDEII CEN library (top) and correlation between sectoring score and loss rate determined by fluctuation test (bottom). The curve (bottom) represents the least-squares linear regression fit of the data. Open circles indicate strains omitted from further analysis.

