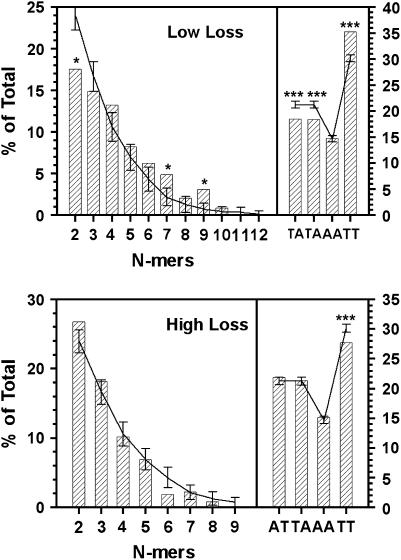
Figure 5.
An/Tn run and dinucleotide content of low- and high-loss CDEIIs. The NdeI site common to all sequences and technically part of CDEII (see Figure 2) was not included in the analysis. Results are shown only for AT, TA, AA, and TT dinucleotides (right). All results are expressed as the percentage of total nucleotides. Curves show the means of randomization trials with error bars showing the standard deviation of 100 trials. *, P < 0.05; ***, P < 0.001.

