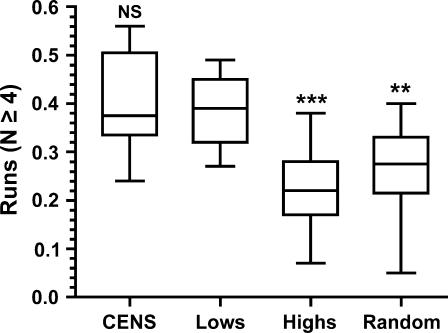
Figure 6.
Box plots of homopolymer run content of CDEII sequences. Horizontal lines indicate the median, with the box showing the 25th and 75th percentile bounds; error bars show the extremes. The results of Bonferroni's multiple comparison test comparing the “Lows” group with all other groups are shown above the plots. CENS, endogenous CDEIIs; Lows, low-loss CDEII population; Highs, high-loss CDEII population; Random, 16 random CDEII clones; NS, not significant; **, P < 0.01; ***, P < 0.001.

