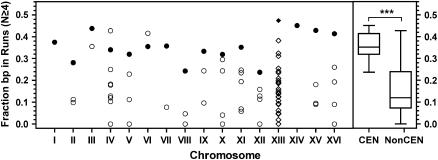
Figure 8.
Run content of AT-rich chromosomal loci. Each circle represents a locus having a local A + T content of ≥90.6%. Chromosome XIII loci (diamonds) have an A + T content of ≥85.9% (see text). Solid symbols designate the centromere loci. Box plots of the run content of centromere and noncentromere loci (as in Figure 6) are shown on the right. ***, P < 0.001 (two-tailed t-test).

