
Figure 2.
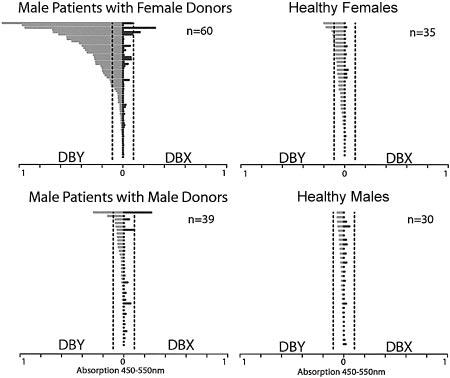
Antibody response to recombinant DBY and DBX in male patients after allogeneic HSCT and in healthy donors. The magnitude of DBY reactivity by ELISA is shown on the left in light gray bars, and the corresponding DBX reactivity is shown on the right in dark gray bars for each individual. Dotted vertical lines indicate the lower limit of values considered positive for the assay (0.1).