
Figure 3.
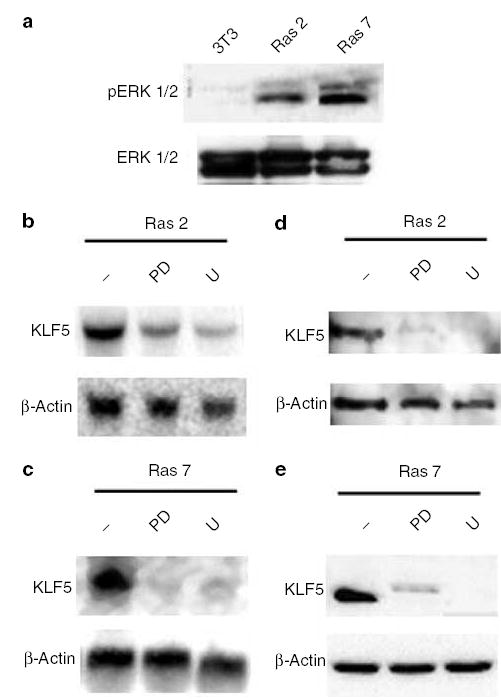
Effect of MEK inhibition on KLF5 expression in H-Ras-transformed cells. Panel a shows the MAPK activity in NIH3T3, Ras 2 and Ras 7 cells as determined by the level of pERK1/2 (top row). The total amounts of ERK1/2 were determined by Western blot analysis using specific antibodies (bottom row). Panels b and c show the results of Northern blot analysis of RNA extracted from Ras 2 and Ras 7 cells, respectively, after treatment with two MEK inhibitors, PD98059 (PD) and U0126 (U). − indicates untreated cells. Panels d and e show the results of Western blot analysis of proteins extracted from Ras 2 and Ras 7 cells, respectively, after treatment with two MEK inhibitors, PD98059 (PD) and U0126 (U). − indicates untreated cells