
Supplemental Figure 1. Generation of the M1-GIC BAC and comparison of Mash1 and GFP.
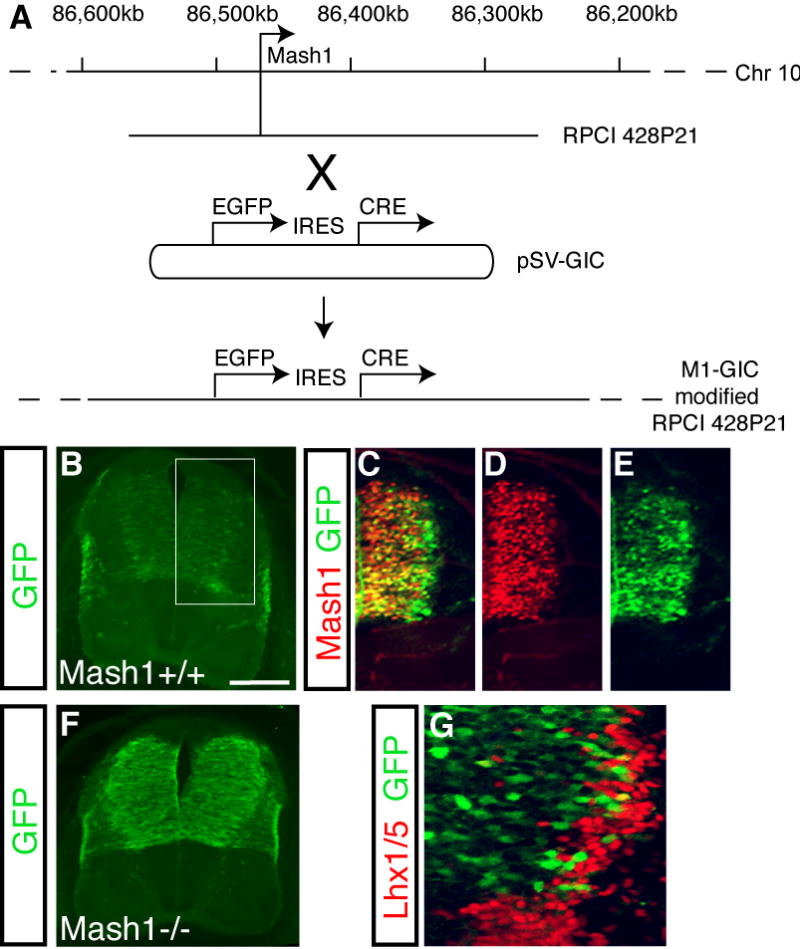
(A) BAC RPCI 428P21 from chromosome 10 containing the Mash1 locus was modified using homologous recombination (Yang et al., 1997). This modification utilized the shuttle vector pSV-GIC that contains a GFP-IRES-CRE cassette flanked by 1kb arms homologous to sequence in the Mash1 locus. This recombination precisely replaces the coding sequence of Mash1 with the GFP-IRES-CRE coding cassette. The resulting modified BAC is called M1-GIC. Transgenic mouse lines were generated with M1-GIC. The GFP reporter is low but it reflects the Mash1 pattern throughout multiple stages and multiple regions including the caudal neural tube (shown here), the telencephalon and diencephalon, sympathetic and enteric nervous systems (data not shown). (B-E) Immunofluorescence on transverse sections of neural tubes from E11.5 M1-GIC embryos with antibodies to GFP (green) and Mash1 (red) show GFP reflects the pattern of Mash1 with boundaries matching precisely in the dorsoventral axis. Persistence of GFP in lateral regions is likely due to the stability of GFP relative to Mash1. (B,F) Immunofluorescence using antibodies to detect GFP demonstrate expression of GFP in the Mash1 null background (F) is dramatically increased over wild type (B). These two images were taken at the identical GAIN to illustrate the difference in levels. This observation is consistent with the negative autoregulation of the Mash1 locus previously reported (Horton et al., 1999; Meredith and Johnson, 2000). (G) Because the persistence of GFP is found continuously throughout the lateral regions adjacent to dI3-dI5, but Mash1 is not required for dI4, we used Lhx1/5, a marker of dI4/6 to examine co-labeling with the GFP. Immunofluorescence using antibodies to detect GFP (green) and Lhx1/5 (red) shows very little overlap of GFP from the M1-GIC line with the dI4/6 population consistent with conclusions drawn from Fig. 4. Scale bar is 175 μm in (B,F) 100 μm in (C-E) and 50 μm in (G).