
Fig. 2.
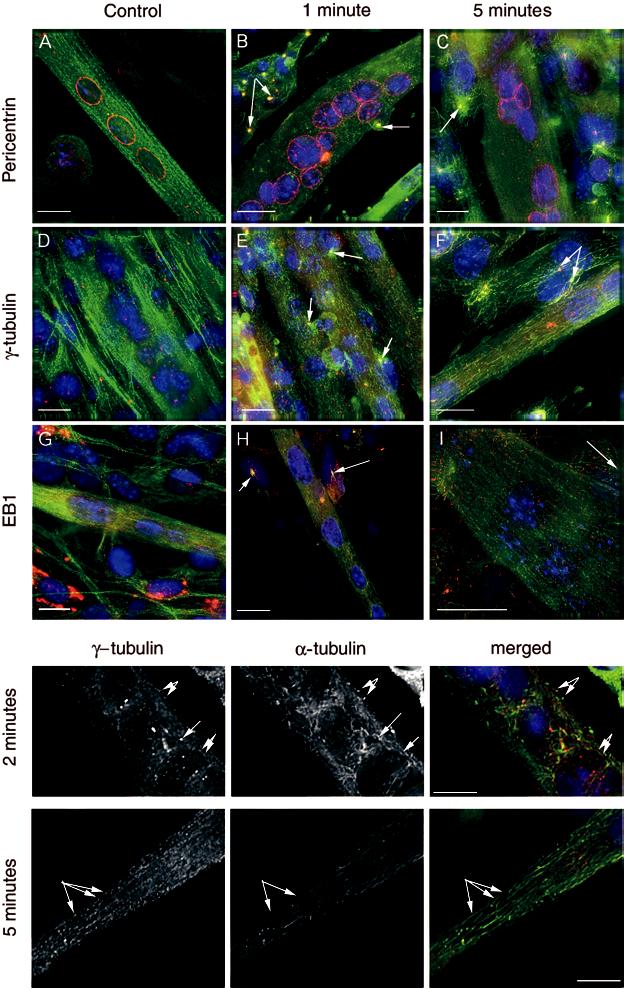
Triple immunostained images of myotubes immunostained for α-tubulin (green), nuclei (blue) and either pericentrin (A, B and C), γ-tubulin (D, E and F) or EB1 (G, H and I) in red. The figure shows both untreated myotubes and myotubes after treatment with nocodazole to induce microtubule depolymerisation. A, D and G show control myotubes, B, E and H show myotubes 1 min after nocodazole treatment, and C, F and I show myotubes after 5 min recovery following nocodazole treatment. The arrows are pointing to undifferentiated cells lying close to the myotubes, in which microtubule asters can be seen, typical of re-growth in myoblasts. These aster formations are not seen in the myotubes. Scale Bar: 20 μl. The separate panels below, show single magnified images of re-growing microtubules in myotubes following 2 and 5 min recovery after nocodazole treatment. The staining for γ-tubulin and α-tubulin are shown separately, as well as the merged image. The arrows point to regrowing microtubules in which a spot of γtubulin appears to be associated with re-growing microtubules.