
Figure 4. RNAi knockdown of uPA and uPAR expression inhibits cell proliferation and induces apoptosis in PC3 cells.
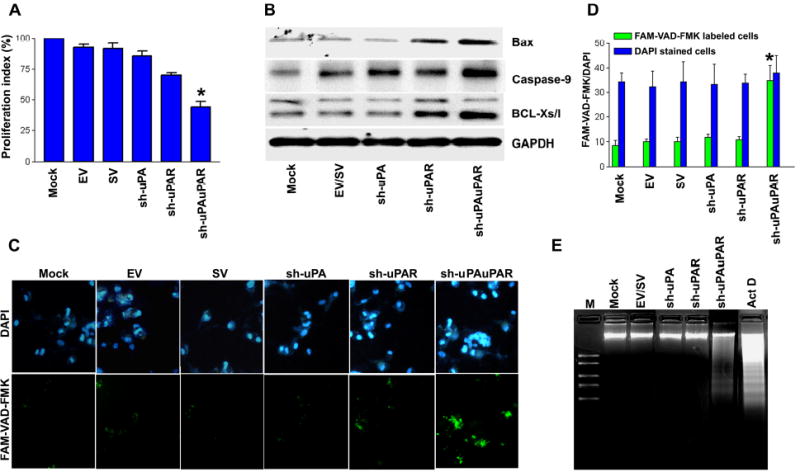
A. Viability of PC3 cells transfected with either gene-specific shRNA plasmids or controls (mock or EV/SV-transfected cells) was revealed by MTT assay. Each bar represents triplicate analyses of mean ± SD where significant difference from controls is represented by an asterisk * (P <0.05).
B. Representative immunoblots show changes in pro-apoptotic gene expression in uPA-uPAR knockdown PC3 cells. GAPDH was used as a loading control.
C. Caspase activation was detected in situ with fluorescence labeling (Green: lower panel) using FAM-VAD-FAK, a cell permeable caspase inhibitor that binds to activated caspases. Nuclear staining was performed with DAPI (Blue: upper panel). It is apparent that a significant number of cells transfected with sh-uPAuPAR displayed green fluorescence.
D. Bar diagram showing quantitative data of DAPI/FMK-VAD-FAK labeled cells ratio from three random fields under a confocal microscope. The ratio of DAPI to FMK-VAD-FAK was significantly increased in cells transfected with sh-uPAuPAR. Significant differences from mock or EV/SV-transfected cells are indicated by asterisks * (P <0.05).
E. DNA laddering was observed in cells transfected with uPA-uPAR shRNA and cells treated with actinomycin D (ActD, 0.2 μg/ml). An agarose gel was stained with ethidium bromide and photographed under UV light. DNA markers were electrophoresed as a kilobase pair reference with standard bands of 2.0, 1.5, 1.0, 0.75 and 0.5 kb (lane M).
(All results are representative of at least three separate experiments.)