
Fig. 3.
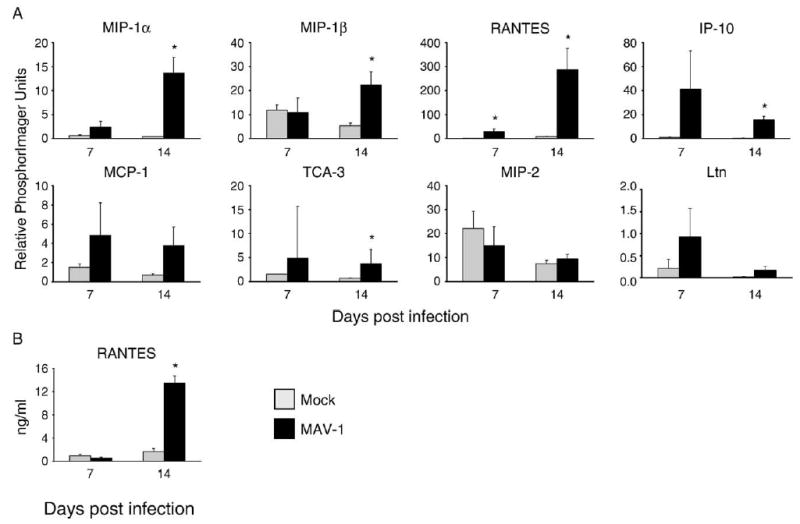
Chemokine responses to MAV-1 in the lung. (A) RPA measurement of chemokine gene expression at the indicated time points in the lungs of mice infected i.n. with 105 PFU of MAV-1 or mock-infected with conditioned media. Quantified data are presented as percentages of the expression of the L32 housekeeping gene. (B) ELISA measurement of protein levels of the representative CC chemokine RANTES in the lungs of MAV-1-infected and mock-infected mice. For both RPA and ELISA, data are presented as means ± standard deviation of values obtained from three mice at each condition (except mock infection at 7 dpi, where n = 2) from one representative experiment corresponding to lanes 4 to 9 in Fig. 1. Statistical significance was determined using Student’s t test (*P < 0.05). Similar results were obtained from a separate independent experiment.