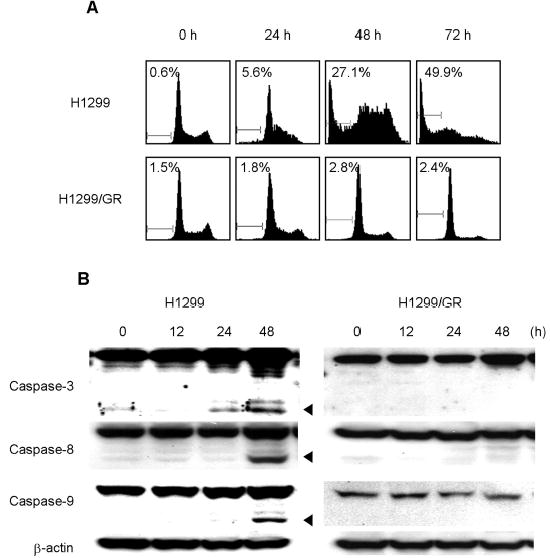
Fig. 2.

Gemcitabine induced apoptosis via caspase activation in H1299 cells. (A) Flow cytometry analysis of H1299 and H1299/GR cells treated with 100 nM gemcitabine for the indicated time periods. Cells were harvested, fixed, and stained with PI. Histograms represent DNA contents. The numbers represent the percentages of sub-G1 cells. (B) H1299 and H1299/GR cells were treated with 100 nM gemcitabine for the indicated time periods, and proteins in whole-cell lysates were analyzed by immunoblotting with anti-caspase-3, caspase-8, and caspase-9 antibodies. The arrowheads represent cleavage proteins. β-actin was used as a loading control.
