Fig. 6.

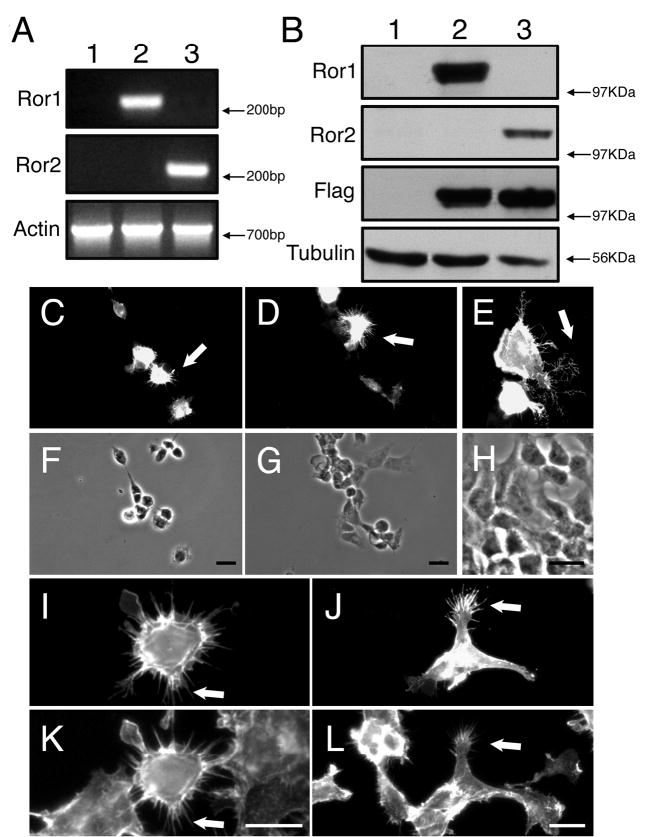
Overexpression of Ror1 and Ror2 in HEK cells. HEK cells were transfected with expression plasmids encoding mouse Ror1 or Ror2 cDNAs and harvested 48 hours later for analysis. (A) Reverse transcription-polymerase chain reaction (RT-PCR) and (B) western blot analysis of pcDNA3-mRor1-Flag (A and B, lane 2) and pcDNA3-mRor2-Flag (A and B, lane 3) transfected HEK cultures. As a control, untreated HEK cultures were used (A and B, lane 1). (C-H) pcDNA3-mRor1-Flag-transfected (C,E,F,H) and pcDNA3-mRor2-Flag-transfected (D,G) HEK cells were stained with anti-Flag (C,D) or anti-Ror1 (E) antibodies. Note the distribution of Ror1 and Ror2 in the soma and in filopodia-like protrusions (arrows in C-E). (I-L) pcDNA3-mRor1-Flag-transfected (I,K) and pcDNA3-mRor2-Flag-transfected (J,L) HEK cells were stained with an anti-Flag antibody (I,J) and counterstained with phalloidin (K,L) to demonstrate the colocalization of Ror proteins with F-actin (arrows in I-L). Bar, 20 μm.
