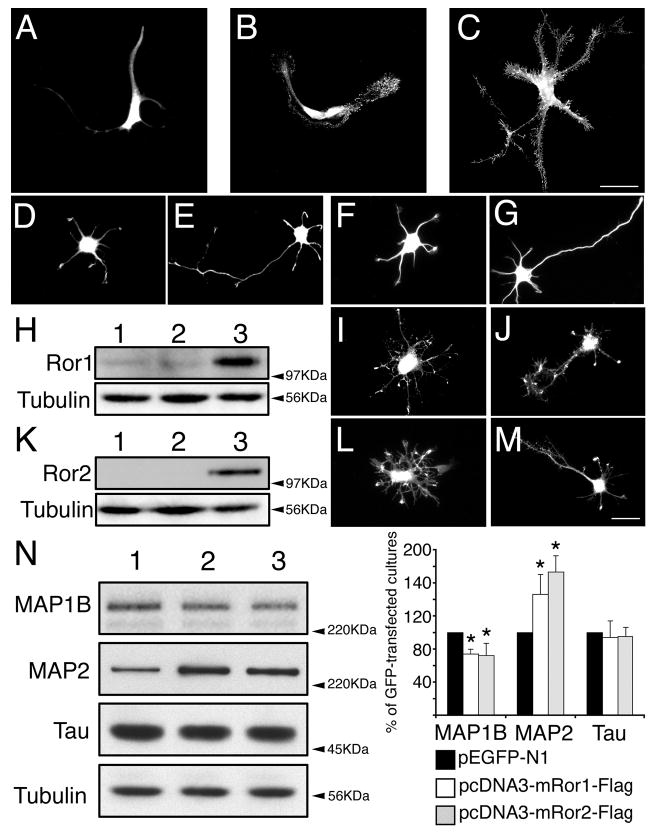
Fig. 7.

Overexpression of Ror1 and Ror2 in astrocytes and hippocampal neurons. Primary astrocytes (A-C) and hippocampal neurons (D-M) were transfected with pEGFP-N1 (A,D,E), pcDNA3 (F,G), pcDNA3-mRor1-Flag (B,I,J) or pcDNA3- mRor2-Flag (C,L,M). Cultures were fixed 24 (A-D, F,I,L) or 48 (E,G,J,M) hours later and stained with GFP (A,D,E), tubulin (F,G) or Flag (B,C,I,J,L,M) antibodies. (H) Lysates from 2-day in vitro sister cultures were analyzed by western blotting to demonstrate overexpression of Ror1. pcDNA3, pEGFP-N1- and pcDNA3-mRor1- Flag-transfected cultures were loaded in lanes 1, 2 and 3, respectively. Membranes were probed with anti-Ror1 and tubulin antibodies. A tenfold increase in Ror1 expression was detected, compared to control levels. (K) Lysates from 2-day in vitro sister cultures of hippocampal neurons were analyzed by western blotting to demonstrate overexpression of Ror2. pcDNA3, pEGFP-N1- and pcDNA3-mRor2- Flag-transfected cultures were loaded in lanes 1, 2 and 3, respectively. Membranes were probed with anti-Flag and tubulin antibodies. (N) Lysates from 2-day in vitro sister cultures were subjected to western blot analysis (pEGFP-N1-, pcDNA3- mRor1-Flag- and pcDNA3-mRor2-Flag-transfected cultures were loaded in lanes 1, 2 and 3, respectively). Densitometries of the immunoreactive bands obtained by western blotting with MAP1B, MAP2 and tau antibodies are shown. The results correspond to the percentage of MAP1B, MAP2 and tau protein levels present in the pcDNA3-mRor1- and pcDNA3-mRor2-Flag-transfected cultures when considering the levels in the GFP-transfected samples as 100%. *P<0.01 compared to protein levels in pEGFP-N1-transfected cultures. Bar, 20 μm.
