
Figure 2.
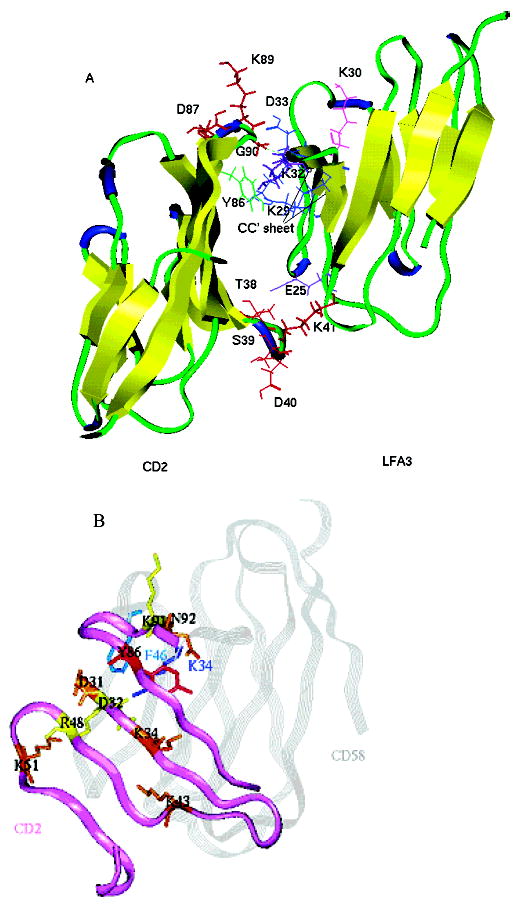
(A) Ribbon diagram of crystal structure of the CD2–CD58 (LFA-3) complex. The residues of hCD2 that are in β-turn regions are shown as red sticks. Tyr86 from CD2 is colored green. Residues from CD58 that are important in the CD2–CD58 interaction are colored: Lys32 and Glu25 in purple, Asp33, Lys29, and Glu37 in blue, and Lys30 in magenta. (B) Superimposition of the CD2 interface (purple ribbon) and CD58 (gray ribbon). The CD2 residues involved in the CD58 binding are labeled and colored on the basis of mutation results and their effects on CD2–CD58 interaction. Mutations D31A, K34A, K43A, K51A, and N92A (brown) had a stronger effect, reducing the level of adhesion by more than 50% and CD58 binding by more than 1 order of magnitude; mutations D32A, R48A, and K91A (yellow) abolished adhesion completely and manifested a 47–127-fold decrease in CD58 binding affinity. The Y86A (red) mutation resulted in a loss of binding to CD58 of more than 1000-fold. CD58 key residues K34 and F46 are labeled.